System Design · Issue 24
How Concurrent Streaming Halves LLM Cold Start
Two config changes cut a 317-second vLLM startup to 167 seconds, no model modifications required.
The bottleneck
Five Minutes of Dead Air on Every Restart
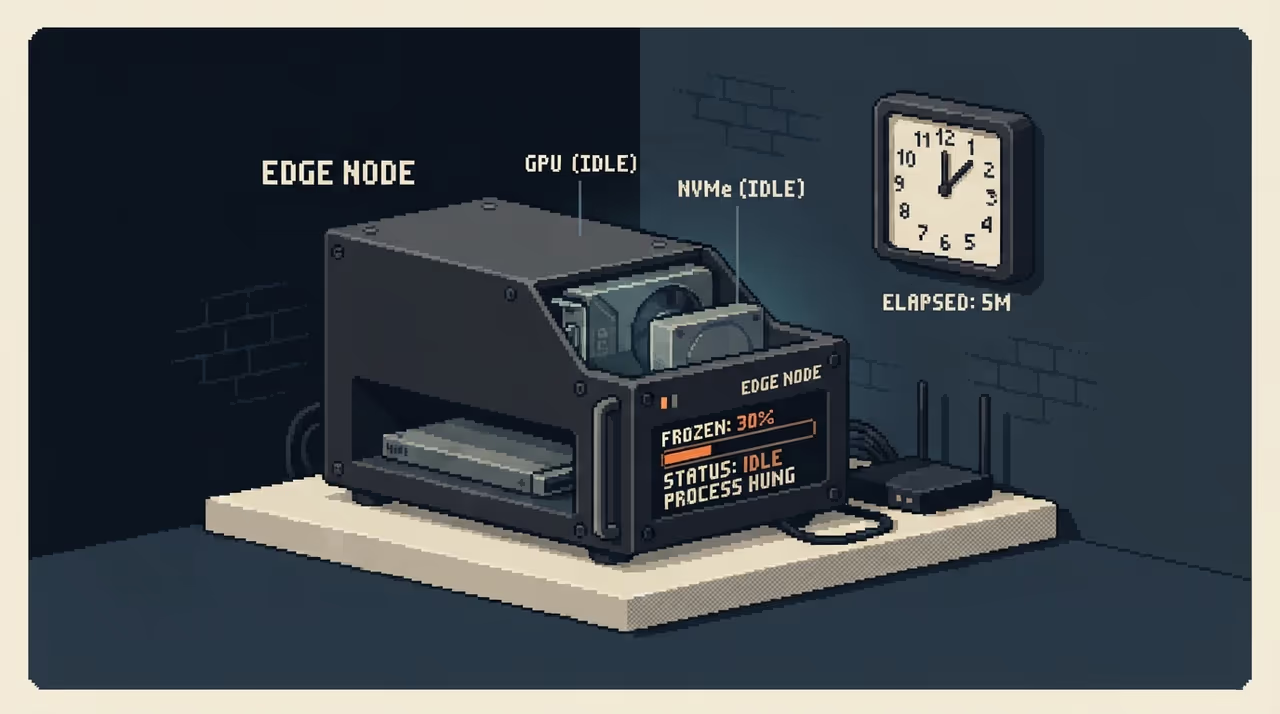
Restarting vLLM is a routine operation during development: tweaking the serving engine, swapping models, refining configs. Each restart triggers a full cold start that took 317 seconds (5:17) for a single Qwen3.6-35B-A3B model, NVFP4-quantized at 20+ GB, running on local NVMe on an NVIDIA DGX Spark node.
- Weight loading (142s)
- torch.compile (39s)
- Profiling / warmup (136s)
- Total cold start (317s)
Weight loading is the single largest chunk, and the default safetensors loader reads weights sequentially, one chunk at a time. A systematic study of vLLM startup confirms the process is predominantly CPU-bound. The author's NVMe sustains ~10 GB/s with parallel reads but only ~1.2 GB/s single-threaded, leaving roughly 8x of available bandwidth on the table.
The fix
Two Config Changes, No Model Modifications
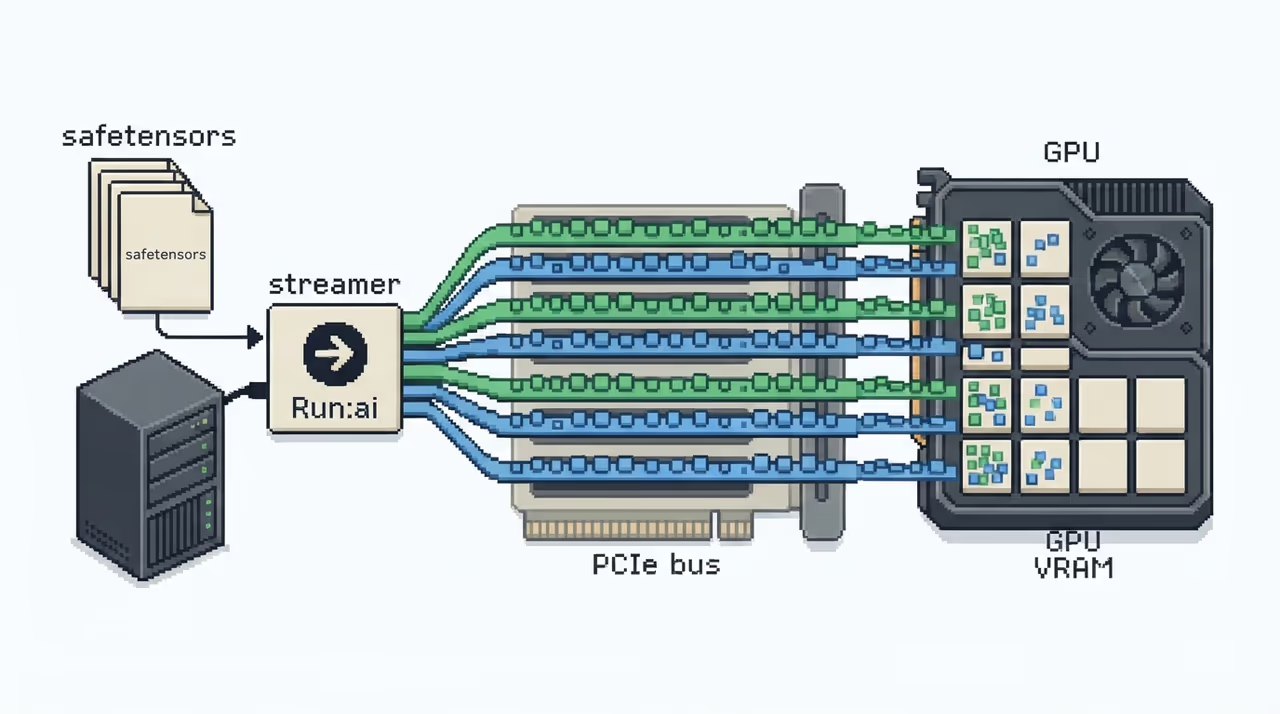
The first change swaps vLLM's default loader for Run:ai Model Streamer, an open-source SDK with a C++ backend that reads tensors concurrently using multiple worker threads. It overlaps storage reads with PCIe transfers since the GPU accesses CPU memory directly, and reads native safetensors with no format conversion.
Persistent compile cache
The second change persists the torch.compile cache across pod restarts. The compiled kernels depend only on model structure, not on weight values, so the result is reusable. By default vLLM writes the cache inside the container, which is wiped on every pod recreation; setting VLLM_CACHE_ROOT to a persistent volume turns a 39-second compile into a quick deserialize.
What invalidates the compile cache
PyTorch's Inductor compiler hashes everything the compiled code depends on: model architecture, layer shapes, dtype, quantization scheme, compile flags, GPU compute capability, and vLLM/PyTorch versions. Fine-tuning (swapping trained weights) is safe and does not invalidate the cache. Any structural change triggers a cache miss and a one-time fresh compile. A stale cache can never cause a failure, only a slow start.
The measurements
From 317 Seconds Down to 167
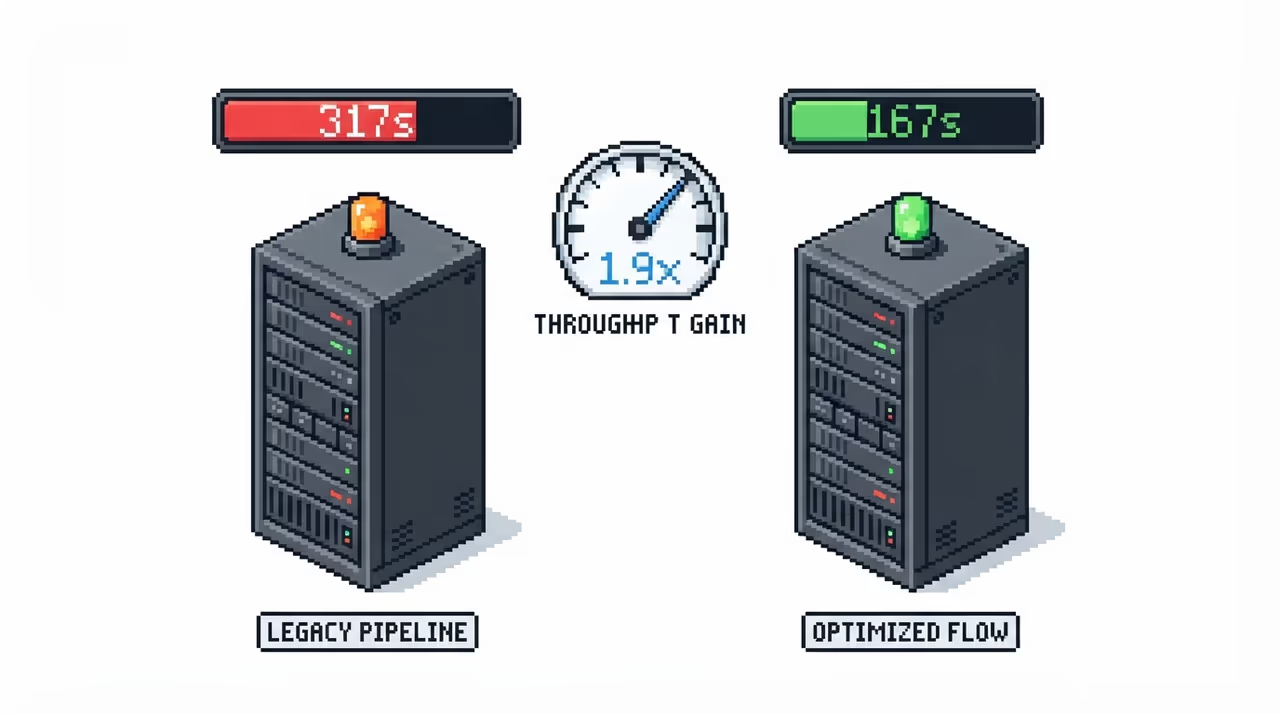
On the Route179 setup (DGX Spark, Qwen3.6-35B-A3B NVFP4, local NVMe, 3-run averages), weight loading dropped from 142s to 59s (2.4x on that phase alone), torch.compile fell from 39s to 10s with a warm cache, and total cold start went from 317s to 167s. That is a 47% reduction with no changes to the model, its weights, or output quality.
Baseline (317s)
Sequential load, fresh compile
Optimized (167s)
Concurrent stream, cached compile
The pattern holds at larger scale. NVIDIA's benchmarks showed model load time dropping from 47s to 7.5s on IO2 SSD, a 6x improvement. Azure's tests on 8x H100 nodes showed the speedup grows with model size: a 233 GiB Qwen model loaded in 37s with the streamer versus 225s with the default loader.
On a 233 GiB model, the default loader swings 80 seconds between runs. The streamer stays within one second.
What it costs
Tuning Concurrency and Chasing the Floor
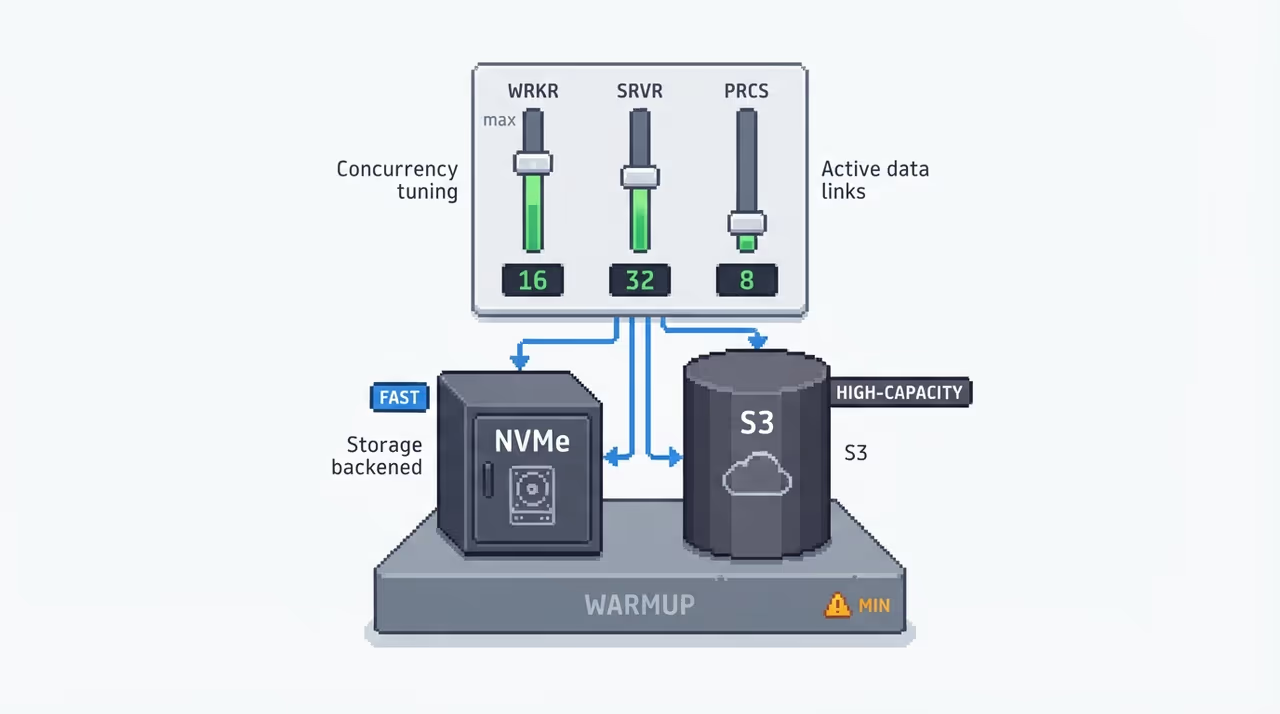
Concurrency tuning is storage-dependent. On local NVMe, throughput plateaued at 8 threads; adding more just added contention. Higher-latency backends like NFS or S3 benefit from 16 to 64 threads because parallelism hides per-request latency.
Local NVMe (plateaus at 8 threads)
Network / object store (needs 16-64 threads)
The compile cache needs persistent storage that survives pod restarts; on serverless platforms the default container path is wiped and the fix does not apply. The streamer package should be baked into the container image, not installed at startup.
The remaining floor
Neither optimization touches the profiling and warmup phase, still 98 to 136s of fixed engine overhead. Heavier approaches like CRIU checkpoint/restore can drop cold start to 2 to 5s for small models but require specific driver and Kubernetes versions.
Wrap-up
Two Knobs That Cut Cold Start in Half
Why it matters
Cold start latency is the tax serverless LLM deployments pay for elasticity. When autoscaling spins up a new pod, it loads 20+ GB of weights before serving a single token, and a 5-minute wait turns into 5xx errors and over-provisioning. Two config changes that halve that wait, without touching the model or its outputs, are the kind of low-risk optimization that spreads through a team quickly. The remaining floor is engine-level profiling and warmup, which is where the next round of gains will have to come from.
The short version
- vLLM's default safetensors loader reads weights sequentially, leaving ~8x of NVMe bandwidth unused.
- Run:ai Model Streamer reads tensors concurrently; weight loading dropped from 142s to 59s.
- Persisting the torch.compile cache across pod restarts cut compile time from 39s to 10s.
- Combined: cold start went from 317s to 167s, a **47% reduction** with no model changes.
- The profiling/warmup phase (~98-136s) is the remaining floor that neither optimization addresses.
Sources
- 1.Optimizing vLLM Cold Start with Model Streaming and Compile Caching | Route179
- 2.Reducing Cold Start Latency for LLM Inference with NVIDIA Run:ai Model Streamer | NVIDIA Technical Blog
- 3.GPU Cold Start on Serverless LLM Inference: 4 Fixes That Actually Work (2026) | Spheron Blog
- 4.Eliminate LLM Cold starts: Load models up to 6x Faster with Azure Blob Storage and Run:AI Model Streamer - Azure SDK Blog
- 9.Breaking the Ice: Analyzing Cold Start Latency in vLLM